Computing in Optimization and Statistics, 2018
About
Welcome to the course repository for the 2017 offering of 15.S60, Computing in Optimization and Statistics. This is an advanced course offered by and for practicing researchers in fields relating to operations research, computer science, applied mathematics, and computational engineering. For an overview of the course, including logistics and session content, please consult the syllabus. Advanced users may wish to access the course repository directly. Below, you can learn more about each of the sessions and access primary materials.
In 2018, 15.S60 was organized by Brad Sturt and Phil Chodrow.
Course Materials
1. Introduction – Jackie Baek and Brad Sturt
Introduces foundational concepts and computing tools, including terminal navigation and basic commands; version control with git and GitHub; and elementary data inspection and manipulation in R and RStudio.
Slides
Code and Data
2. Data Wrangling and Visualization – Andy Zheng
This session will introduce basic techniques in data wrangling and visualization in R. Specifically, we will cover some basic tools using out-of-the-box R commands, then introduce the powerful framework of the “tidyverse” (both in wrangling and visualizing data), and finally gain some understanding of the philosophy of this framework to set up deeper exploration of our data. Throughout, we will be using a publicly available dataset of AirBnB listings.
Sessions 2-4 all use a data set of Boston AirBnB rentals, provided courtesy of AirBnB and Kaggle. You can download each of the three components by clicking the links below:
3. Statistical Modeling and Machine Learning – Colin Pawlowski
This session introduces basic concepts of machine learning and their implementation in R. Topics include elementary regression; regularization and model selection; natural language processing; and model diagnostics. Throughout the session, students use data manipulation and exploration skills to visualize and evaluate models.
Presentation Materials
R Code
4. Advanced Topics in Data Science – Phil Chodrow
Motivation
Data science is rarely cut-and-dried; each analysis typically provides answers but also raises new questions. This makes the data scientific process fundamentally cyclical:
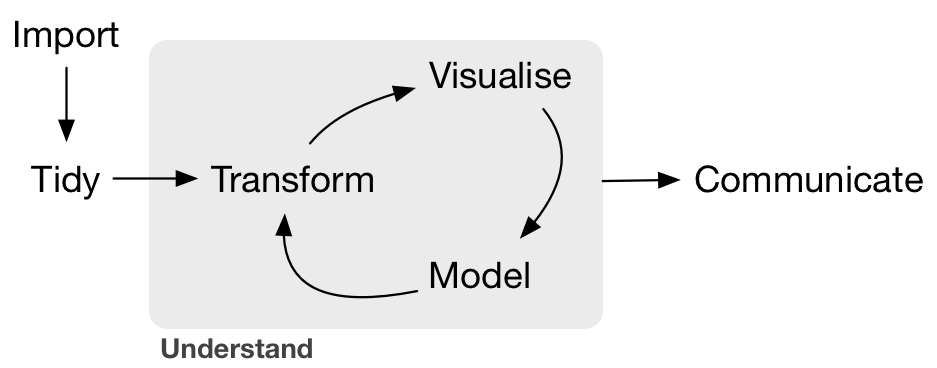
Image credit: Hadley Wickham
A skilled analyst needs to be able to smoothly transition from data manipulation to visualization to modeling and back. In this session, we focus on using the tidyverse set of packages to smoothly navigate the Cycle of Data Science.
Learning Objectives
Topics covered include:
- Reinforcement of Session 2 tools like
dplyrandtidyr. - Efficient, tidy iteration with
purrrandmap. - Tidy model inspection and selection with
broom.
While learning these tools, we work a complex case study that will require multiple iterations of manipulation, visualization, and modeling to test a data scientific hypothesis.
Materials
- Slides: Presentation and source.
- Case Study: Student script for the session, complete script for reference, and readable writeup with source.
5. Deep Learning – Zachary Blanks
Introduces basic concepts from deep learning via TensorFlow, Keras, and R.
Materials
6. Introduction to Optimization with Julia and JuMP – Arthur Delarue and Konstantina Mellou
Introduces the Julia programming language, elementary optimization in with the JuMP module, and interacting with MIT Sloan’s computing cluster, Engaging.
Materials
7. Nonlinear and Integer Optimization in JuMP – Arthur Delarue and Konstantina Mellou
A discussion of more advanced optimization techniques with Julia and JuMP, including nonlinear and mixed integer techniques.