Group Project
Part of your final assessment in PIC16A is via a group project. In this project, you and your partners will perform and communicate about a complete data analysis of a real data set.
An important task in the ecology of the Antarctic is to catalog the many different species of penguins in that area. Determining the species of a penguin often requires a combination of biological expertise and many precise measurements, which can be difficult to obtain.
In the dystopian future, there are too many penguins:
Because there are so many, we can’t take many detailed measurements on all of them! In order to classify the species of penguins in large volume, we need to figure out which measurements are most important for distinguishing penguin species.
Your goal in this mini project is to determine a small set of measurements that are highly predictive of a penguin’s species. Options include (but are not limited to) the island on which the penguin was encountered, the length and depth of the culmen (bill), the length of the flipper, the body mass, and the sex of the penguin. That is, you should determine which of these features is most predictive of the penguin’s species, using at least three distinct machine learning algorithms and evaluating the results.
Part of the point of this project is to use a small number of measurements (i.e. columns in the data). Your final set of models must use one (1) qualitative feature and two (2) quantitative features, corresponding to a total of just three distinct measurements per penguin. You’re permitted to use different features in each model, but each one must use one qualitative feature and two quantitative features.
For training and evaluating your models, we will use the Palmer Penguins data set. The Palmer Penguins data set was collected by collected by Dr. Kristen Gorman and the Palmer Station, Antarctica LTER, a member of the Long Term Ecological Research Network. Download the CSV data. It contains measurements on three penguin species: Chinstrap, Gentoo, and Adelie.

In data science, it is important to develop a thorough understanding of the data that you are attempting to model. I recommend consulting these helpful videos to build your knowledge of penguin behaviors outside their natural habitats.
Timeline
You’ll have several scheduled discussion periods in Weeks 7 and 8 to work on this project (see the Schedule). In total, the project is intended to require approximately 10 hours of effort from each of you (that is, ~30 total person-hours for a three-person group, or ~20 total hours for a two-person group). You are expected to coordinate with each other to schedule additional meetings or delegate responsibilities as appropriate to complete the project.
Projects are due on the last day of instruction. There will be an optional opportunity early in Week 10 to submit your project for a “mock grade” in order to get feedback and learn what you can do to improve your work.
Submission Logistics
Your project should be contained and submitted in a single Jupyter notebook, rendered as a PDF file. You’ll complete some components of the project in different notebooks over the course of the scheduled Discussion periods. Your group is responsible for moving the required code into your final project file.
It can be challenging to collaborate on a single Jupyter Notebook in which multiple people need to contribute code. One way to address this is to share the notebook in Box or a similar tool. Another good alternative is Google Colab, which allows you to work on Jupyter Notebooks in a collaborative environment somewhat reminiscent of Google Docs. Please note that Colab is not appropriate for use in Discussion activities – we still expect you to use Jupyter Notebook while screensharing.
Working in Groups
In most cases, every group member will receive the same grade on the project. If a group member has made a much smaller contribution to the project than the other members, they may receive a lower grade. I assess this by considering the Group Contributions Statement (see below), as well as via communication from students.
More concretely, I expect that:
- Every group member should play a major role in creating at least one figure.
- Every group member should play a major role in creating, assessing, and discussing at least one model.
- Every group member should make substantive contributions to the written explanations throughout the project.
Your project is required to include a Group Contributions Statement in which you briefly describe which group members contributed to which parts of the project (parts listed below). Please place the Group Contributions Statement at the beginning of your project. Here is an example of a Group Contributions statement.
“All three of us wrote the data acquisition and preparation. Zenith led Figure 1 and the logistic regression model. Rodrigo led Figure 2 and the decision tree model. Essun led Figure 3, Table 1, and the support vector machine model. Zenith wrote the explanation of all figures, Essun wrote the explanation of the first two models, and Rodrigo wrote the explanation of the third model and the conclusion. We all checked each other’s work and made revisions to code and writing.”
Your primary resource in this project should be your group members. However, if you are all stuck on a particular aspect, you are welcome to ask for help from your peers on Campuswire. You can also come to Student Hours, preferably as a group, to talk to me or the TA about your project.
Your project should contain the following components, demarcated by Markdown headers (##).
- Group Contributions Statement. See above.
- Data import and cleaning. You’ll need to write code to read in your data; separate it into training and test sets; and clean it in various ways. In some lecture videos, you might have seen me clean before I split for explanatory purposes. In this project, however, you are required to split your data before you clean in order to ensure that information from your cleaning process doesn’t accidentally pollute your test set. This means that you’ll need to perform the cleaning operation twice, once on the training and once on the test set. Make sure that any repetitive operations are placed in functions and reused – don’t copy and paste code!!
- Exploratory Analysis. Compute summary statistics and construct visualizations about the relationships between variables. Your exploratory analysis should include at least 3 figures and at least 1 displayed table. You must demonstrate three different types of figures, such as scatterplots, histograms, boxplots, and barcharts. At least one figure must contain multiple axes. At least one of your display tables must use
df.groupby()to summarize data across multiple qualitative categories. This section may include data loading, preparation and cleaning. Please note that visualizations related to cross-validation and decision regions are not exploratory visualizations and do not count toward this requirement. For each figure, you should explain how it illustrates a point which supports your modeling decisions below. Even if you ultimately select your features using some method that is unrelated to the figures, your discussion should give your reader an intuitive interpretation about why those features might be helpful or informative. All figures and tables should be polished and legible, with clear legends and axis-labels. 2-person groups need include only 2 figures and 1 table. - Feature Selection. Your models in the next section will use one qualitative feature (like Island or Sex) and two quantitative features (like Culmen Length or Body Mass). You should spend one section in which you perform an analysis to choose these features, and justify your choice. Your approach can be based on your exploratory data analysis; automated feature selection; or any other method – but you must be prepared to justify and write about your proposal. You are permitted to use different combinations of features for each of your three models (below). In this case, you should use the Feature Selection section to explain and illustrate your approach for a single model, which you can then repeat (without extensive explanation) for the other two models. Please remember that repetitive code should be wrapped in functions.
- Modeling. Deploy at least three machine learning models and evaluate their performance. You can use any three machine learning models from Scikit Learn, except decision trees. Possibilities include but are not limited to multinomial logistic regression; random forests; support vector machines; nearest-neighbor classifiers; and neural networks. Must include, for each of three models:
- Cross-validation to choose complexity parameters.
- Evaluation on unseen testing data, including a confusion matrix.
- A visualization of decision regions for the model, with one plot corresponding to each value of the qualitative variable. You are not permitted to use the
mlxtendpackage to construct your decision regions. Your colors must be consistent between your decision region plots. You must also provide a readable legend and correct axis labels. - Discussion of the mistakes made by each model. Your discussion should give intuition for why the model fails in certain cases, using the decision regions to illustrate your explanation.
- Discussion. Describe the overall performance of your models, state which combination of model and features (measurements) you recommend. Discuss how the model could be improved if more or different data were available.
Details on Decision Regions
For each model, you are expected to create decision region plots. You can learn more about the basic concept, and find some code to help get you started, in these notes from Live Lecture.
Here’s an example of a well-constructed set of decision-regions in which the qualitative variable used was the island.
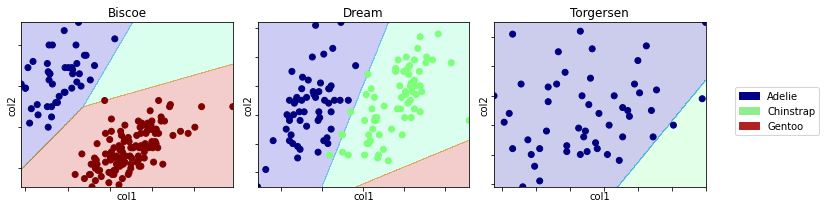
Please note:
- There is an informative legend that states which species corresponds to which colors.
- Each plot has informative titles and axis labels (I’ve intentionally hidden which columns I’ve used; you should be sure to clearly state them).
- The plots are easy to read and compare side-by-side.
For full credit, your decision regions code should be wrapped in a function that allows you to easily create different plots.
I encourage you to get creative! Some customizations you can try include:
- Showing different sets of plots for the training and testing data.
- Highlighting model prediction errors.
- Changing up the colors.
- Anything else you can think of! Feel free to run it by me if you aren’t sure.
The project is worth 15% of your final grade, and will be graded out of 100 points. All members of the team will receive the same project grade, unless I either (a) receive private communication from a team-member that raises concerns about the team’s collaboration or (b) the contributions statement suggests a highly inequitable division of labor.
The exact rubric for the project is fairly detailed, but here’s the high-level breakdown:
Here’s how I’ll assess your project:
- 20% for a clear and equitable Group Contributions statement.
- 30% for Writing, Documentation, and Style: Clear expository writing of the analysis, including narrative text walking the reader through the analysis; description of how the models work; docstrings and comments; and a critical discussion in the final section. This part of the rubric also includes coding style, especially wrapping repetitive code in functions to avoid code duplication.
- 25% for Exploratory Analysis: A helpful exploratory analysis, including at least three figures and at least one table that support your decisions in the Modeling section. 2-person groups need include only 2 figures and 1 table. These figures and tables must be relevant to your modeling, and this relevance must be explained in your text.
- 25% for Modeling: A full modeling pipeline, in which you deploy three or more machine learning models, describe how they work at an intuitive level, train them on data, and systematically evaluate their performance, using confusion matrices and decision regions for each one. Your evaluation methods should include both cross-validation to select a candidate model and evaluation on unseen testing data to evaluate its overall predictive power. You will get full credit in this category if you construct at least one model which scores 95% accuracy or above on unseen test data. 2-person groups need include only the two required models.
I will have slightly lower expectations for the writing component for 2-person groups, but not much lower.
Your work on the project during scheduled discussion sections will additionally count toward your participation grade, as in any other discussion section.
I’ve asked you to write your project in a tutorial format, from which others could learn about machine learning in Python. What should this look like?
Here is a very nice analysis of the famous Titanic survivors data that exemplifies the stages of data analysis and good expository writing. Your projects are not required to be as detailed as shown here, but this analysis would be an excellent place from which to draw inspiration. Please notice:
- Explanations: The ratio of words to code and figures is high.
- Iteration: The writers often start with one machine learning model, and then improve it (or compare it to competitors) as they go.
- Discussion: The author critically considers what has been learned from the model; where the model might fail; and what this implies about the data.
You can also steal some good tricks here with pandas, matplotlib, and scikit-learn!
Wondering About Data Writing?
If you’re not sure whether you are practicing effective data writing, ask yourself:
Could the Week 6 version of me learn how to perform data analysis and machine learning, using my writing as a tutorial?
If so, you might be writing well about your project! If you’re still not sure, talk to your group members and then feel free to ask me.